Oct 13, 2026
Flood plain concentration risk: spotting it when two suppliers share one zone
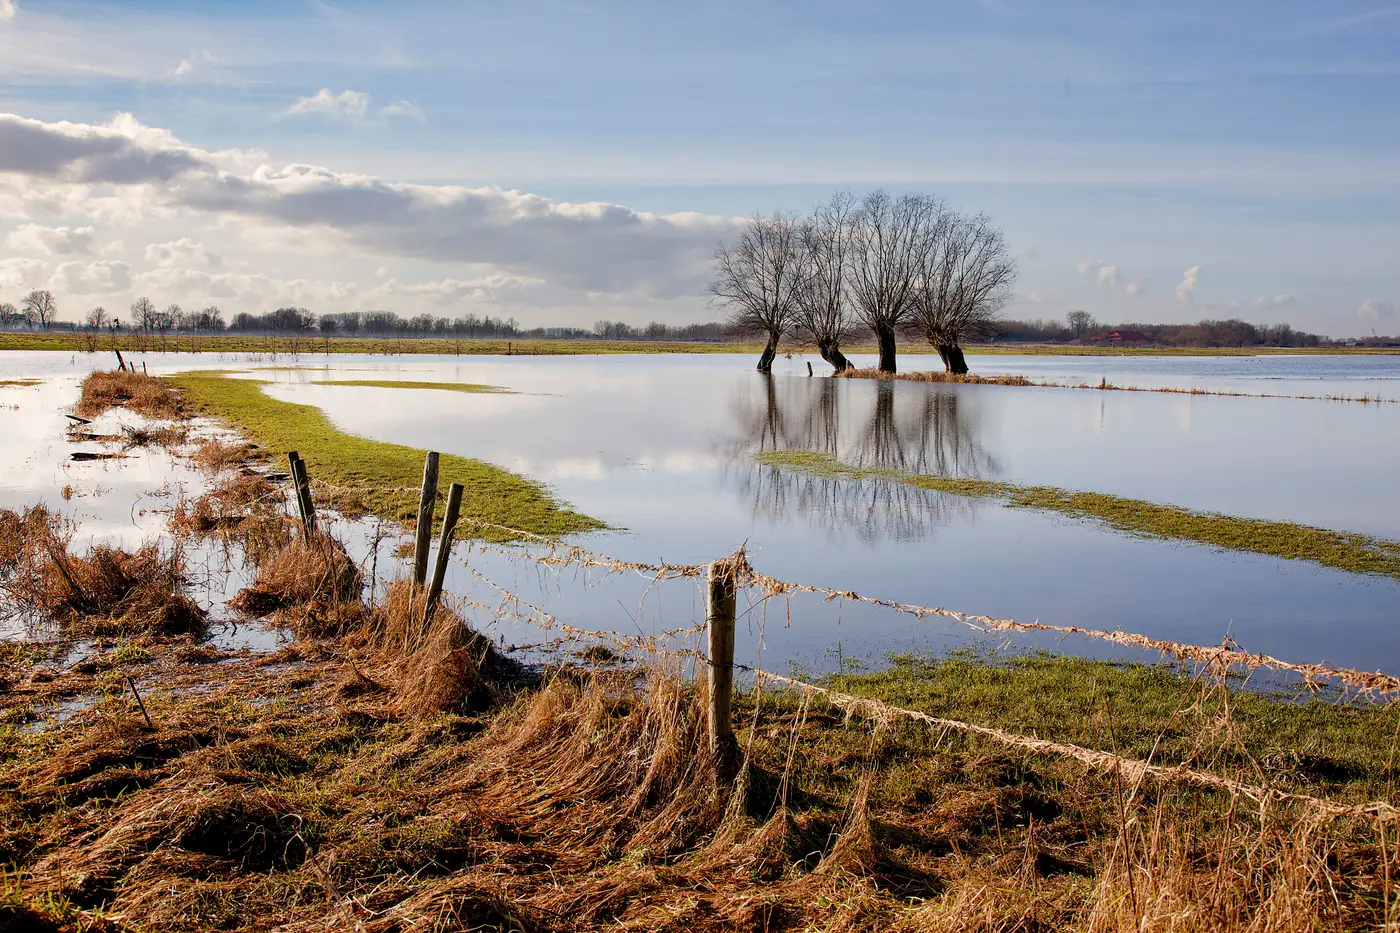
Two suppliers can look nothing alike on paper. Different states, different tiers, different purchase categories. Then a river rises and both ship late in the same week, because both sit on a bend of the same flood plain fifteen miles apart. That's concentration risk hiding in plain sight, and it doesn't show up when you review suppliers one at a time.
Why a supplier-by-supplier review misses it
Most hazard reviews happen the way procurement files work: one vendor record at a time. Someone pulls a FEMA flood zone letter or a county GIS layer for Supplier A, files it, moves to Supplier B. Each review passes. Nobody ever lays the two sites next to each other on the same map, because the review was never built to do that. It was built to answer "is this site exposed," not "are these two sites exposed to the same water."
Flood plains don't respect org charts or supplier tiers. A primary and its backup can sit on opposite banks of the same river, both inside the hundred-year line, both relying on the same floodwall upstream. If that wall overtops, you don't have a backup. You have two copies of the same risk.
What actually counts as overlap
A shared flood plain is a hydrological exposure area, and it can stretch for dozens of miles along a river system or span a shared coastal surge zone. Sites inside that same zone can sit in different towns, on different roads, with different addresses. Proximity on a road map means nothing here: plants twenty minutes apart by car can sit on entirely different watersheds, while plants two hours apart can share the exact same one.
This is where generic flood-zone PDFs fall apart as a concentration-risk tool. They tell you a point is inside or outside a mapped zone. They don't tell you whether that point shares exposure with any other point on your supplier list, because they were never cross-referenced against your list in the first place. Someone has to put every site on one map, at the same time, and look for clusters.
How to check for it without rebuilding your spreadsheet from scratch
Start with coordinates, not addresses. Street addresses don't tell you elevation or proximity to a channel; a lat/long pin does. Get every active supplier site down to a coordinate.
Then plot the full list against current flood plain, storm surge and terrain layers in one pass, not in batches by category or tier. Concentration risk only shows up when you can see the whole footprint at once. A primary supplier reviewed in January and a backup reviewed in June will never get compared to each other unless both sit on the same map on the same day.
Look for sites that fall inside the same exposure polygon, even if they're owned by unrelated companies on your vendor list. That's the signal procurement usually misses: two unrelated suppliers, same water.
Finally, rank what you find. Not every site in a flood plain carries the same exposure tier, and a register that just flags "in zone" or "out of zone" won't tell you which overlapping pair matters most for your single points of failure. You need exposure tier by site, so a primary-and-backup pair that both land in high-tier exposure gets flagged above two low-tier sites that happen to share a zone but barely touch it.
This is the gap Supply Chain Hazard Mapping was built to close: a yearly pass over your full site list, checked against current imagery rather than a static flood-zone letter, that returns a ranked register showing which sites are exposed and by which hazard, so overlap between suppliers is visible instead of buried across separate files.
If your backup supplier has never actually been checked against where your primary one sits, that's worth finding out before the next storm does it for you.