Oct 26, 2026
100-year vs. 500-year flood plain: what the label actually tells a risk manager
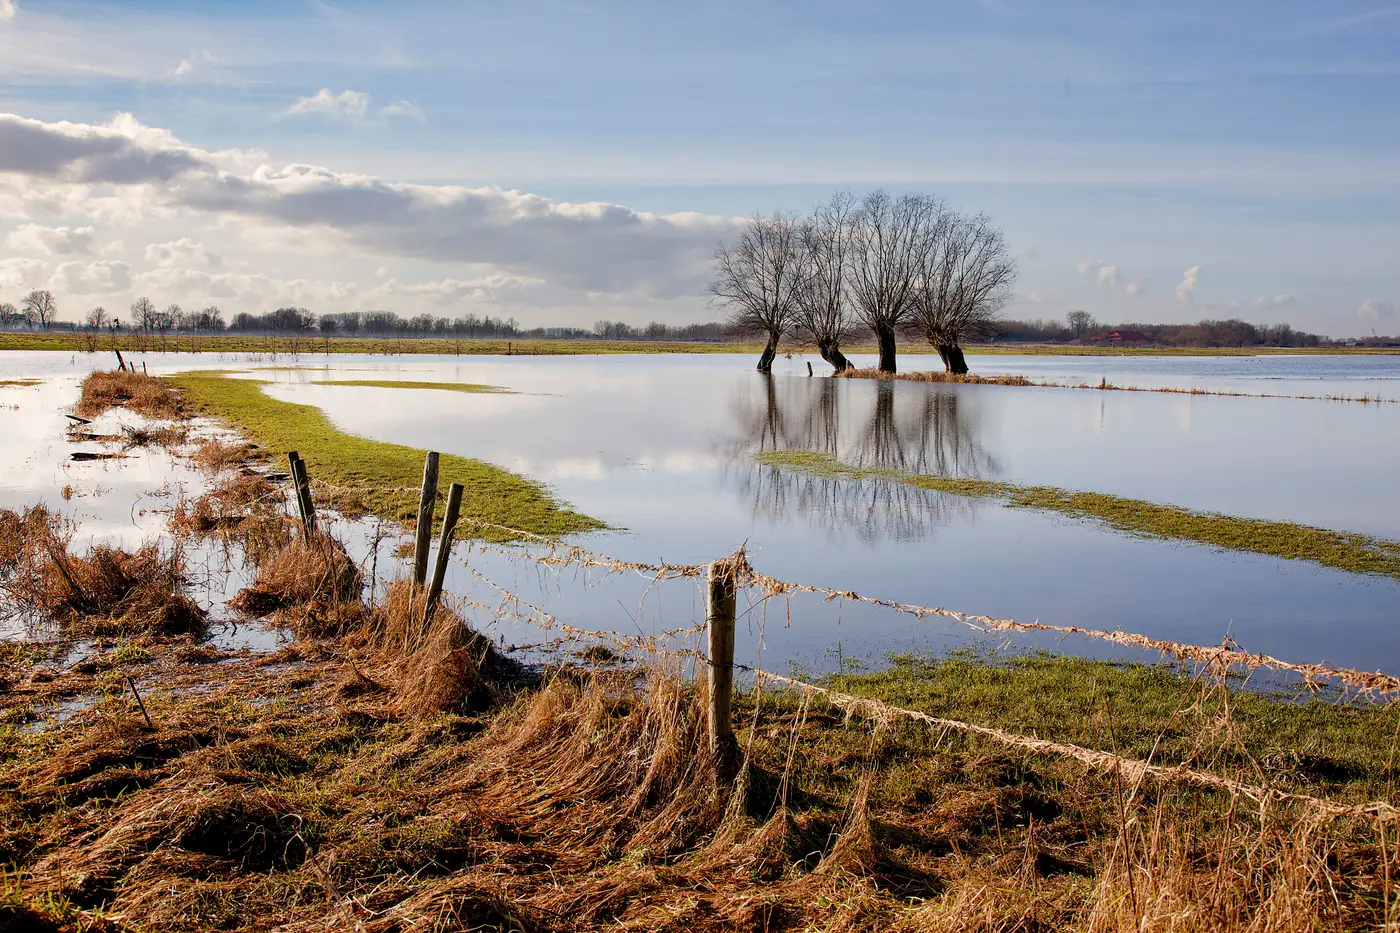
A supplier's address comes back "in the 100-year flood plain" and someone on the team treats that as a yes/no answer. It's actually a one-year probability built for insurance underwriting, and it was never designed to rank a hundred supplier sites against each other.
What the two zones mean
FEMA's Special Flood Hazard Area, the "100-year flood plain," is land with a 1% chance of flooding in any given year. Run that forward 30 years, the life of a typical mortgage, and the cumulative odds work out closer to one in four. The label sticks because it's shorter than "1% annual exceedance probability," but it has led a lot of procurement teams to read "100-year" as "once a century" and relax.
The 500-year flood plain (FEMA's "moderate flood hazard" or Zone X shaded) is the 0.2% annual chance band. It sits one ring out from the 100-year line on the flood insurance rate map and usually shows up as a lighter shade on the same panel. Lower annual odds, same basic math problem: a long-enough time horizon turns a small annual probability into real exposure.
Neither zone is a wall. Water inside a 100-year zone doesn't know to stop at the boundary of the 500-year zone in an unusually wet year, and plenty of supplier sites sit just outside the shaded area on a map drawn from rainfall data that predates their facility.
Why the designation is a weak screen on its own
A few things make the FEMA zone a rough starting point rather than a finished risk call:
The maps lag the ground. Many flood insurance rate maps are a decade or more old. Watersheds change, upstream development changes runoff, and a zone boundary drawn in 2011 doesn't reflect a warehouse built in a floodplain fringe in 2019 or a culvert that's since silted up.
The zone covers a parcel, not a building. A supplier's legal address can straddle a flood zone boundary. The loading dock might sit in Zone AE while the office sits in Zone X. A spreadsheet pulling zip-code-level or parcel-centroid data misses that split entirely.
It only answers for flood. A supplier can clear the FEMA flood check and still sit in heavy wildfire fuel load, on landslide-prone slope, or inside a storm surge inundation zone. Treating "not in a flood plain" as "low hazard" skips three other ways a site goes down.
It doesn't give you a tier you can rank against. FEMA zones are built for insurance underwriting, not for stacking a hundred supplier sites against each other by exposure. A risk register needs something sortable: which sites carry the highest exposure, to which hazard, so the team knows where to push for contingency plans first.
What a usable exposure tier looks like
For supplier risk screening, the useful output isn't "in zone AE, yes or no." It's an exposure tier, a relative ranking of how exposed each site is, checked hazard by hazard, against current conditions rather than a map that was current when it was drawn. That means looking at flood plain boundaries alongside wildfire fuel load, landslide terrain, and storm surge exposure for the same site, at the same time, and tying the call back to actual imagery of where the supplier's buildings sit.
That's the gap Supply Chain Hazard Mapping is built to close: it runs your full supplier list against all four hazard types once a year and returns a numbered register entry per site, with the hazard type, the exposure tier, and the imagery the call is based on, instead of a FEMA zone lookup standing in for the whole picture.
If your current register is a column of "Zone AE / Zone X" pulled from a flood map PDF, it's worth checking what the other three hazards look like for the same sites.