Nov 2, 2026
Wildfire fuel load scoring explained for facility risk screening
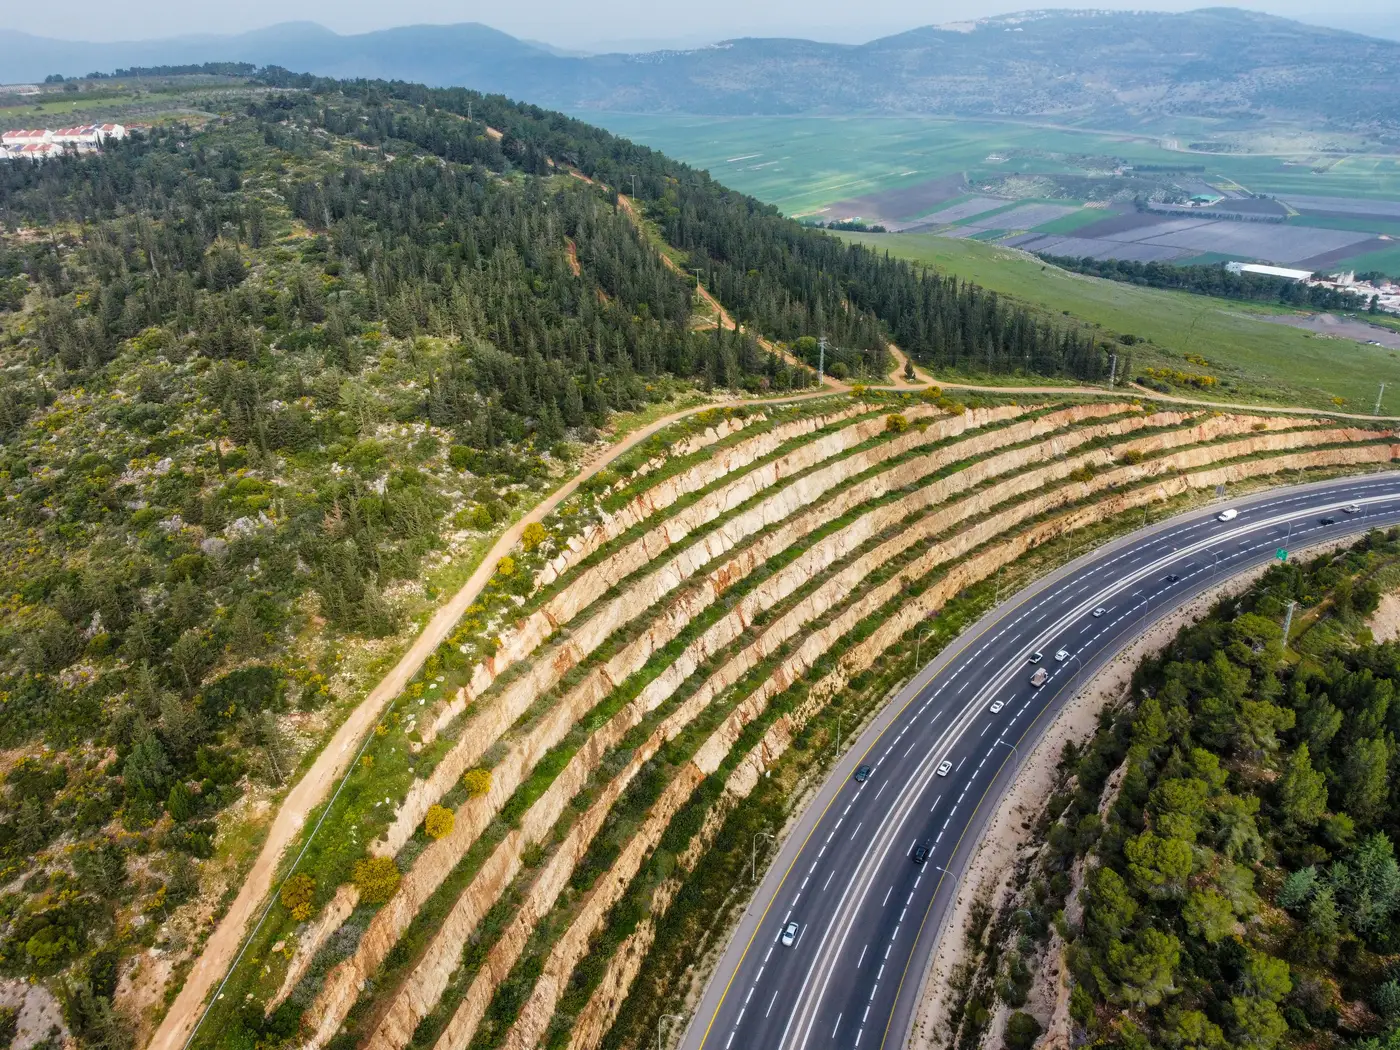
When a supplier questionnaire comes back saying "no known wildfire exposure," what is that answer actually based on? Usually a zip code lookup against a state fire hazard severity zone map, which tells you about the jurisdiction, not the fence line. Fuel load scoring asks a narrower question: how much burnable vegetation sits close enough to a specific building to carry fire to it.
What fuel load scoring measures
Fuel load is a wildland fire term before it's a risk term. It describes the volume and density of combustible material, brush, dead timber, dry grass, canopy cover, sitting within a given distance of a structure. A fuel load score for facility screening translates that into something a procurement team can use: a rating of how much vegetation sits in the zones that matter, usually the first 30 meters out from the building, then out to 100 meters, since that's roughly where ember cast and radiant heat do most of the damage.
A flood zone lookup is a line on a map. Fuel load scoring requires reading the ground itself, because two warehouses in the same county, same fire district, can carry very different exposure depending on whether the lot behind one was cleared last season and the other backs onto scrubland that hasn't seen a controlled burn in a decade.
From vegetation density to an exposure tier
The useful output for a risk register is a tier, not a raw vegetation percentage: low, moderate, high, severe. An analyst can sort a supplier list by tier without reading a vegetation report for every site. A fuel load exposure tier usually folds in three things at once: how dense the vegetation is close to the building, how continuous it is (a scattered tree line behaves nothing like an unbroken fuel bed), and how it sits relative to slope and prevailing wind. Fire runs uphill, and with wind, far faster than it spreads on flat, still ground.
This is where wildfire hazard classification for buildings diverges from a general wildfire risk map. A regional map tells you a county sits in a high-hazard fire zone. It says nothing about whether the specific supplier building sits on a cleared industrial pad with a parking lot buffer, or backs straight onto a fuel break nobody has maintained in years. Two facilities ten miles apart in the same hazard zone can land in different exposure tiers once someone looks at the vegetation around each one.
Why this matters across a vendor list, not one site
Most procurement teams don't have a wildfire question about one supplier. They have the same question about forty or four hundred of them, scattered across regions where self-reported hazard data ranges from accurate to a form filled out once in 2019 and never touched again. Scoring every site the same way, on the same cadence, against the same distance bands, is what turns that pile of questionnaires into something a risk manager can rank: which sites need a closer look this year, which ones moved up a tier because the lot behind them grew in, which ones can wait.
That consistency is the part a spreadsheet built from generic hazard-zone PDFs can't give you. A PDF tells you what zone a site is nominally in. It doesn't tell you whether the vegetation around that specific building changed since last year's review, which is usually the thing that pushes a facility into a higher tier.
Supply Chain Hazard Mapping screens a full supplier footprint against wildfire fuel load, along with flood plain, landslide terrain and storm surge exposure, and returns a ranked register showing exactly which sites carry which hazard, and why.
If your vendor list has never been checked against fuel load at the building level, that's worth closing before the next renewal cycle.